Shortcodes
[smart_stats] Shortcode Guide
A user guide for the smart_stats shortcode.
Last updated on 27 Oct, 2025
What does it do?
The smart_stats shortcode allows you to display data on a webpage in the form of one or multiple pie charts.

How do I use it?
To embed this shortcode into the page, you need to copy the following HTML:
[smart_stats background_colour="" cutout="" title="" description=""]
   [smart_stat background_colour="" id="" title="" pie_percentage="" value="" type=""][/smart_stat]
[/smart_stats]
Rules:
Outer Shortcode:
id="" - an identifier for the shortcode container.title="" - the title above the charts.description="" - a subheading below the title.cutout="" - what percentage of the chart should be cut out. (0 = full pie chart)background_colour="" - set all of the charts to be the same colour with a hexcode.
Inner Shortcode:
id="" - an identifier for the shortcode stat.title="" - the title for the chart.pie_percentage="" - the percentage of the pie chart to fill. (0/100)cutout="" - what the size of the hole cut out of the middle of the chart. (0 = full circle)background_colour="" - sets the colour of the chart with a hexcode.
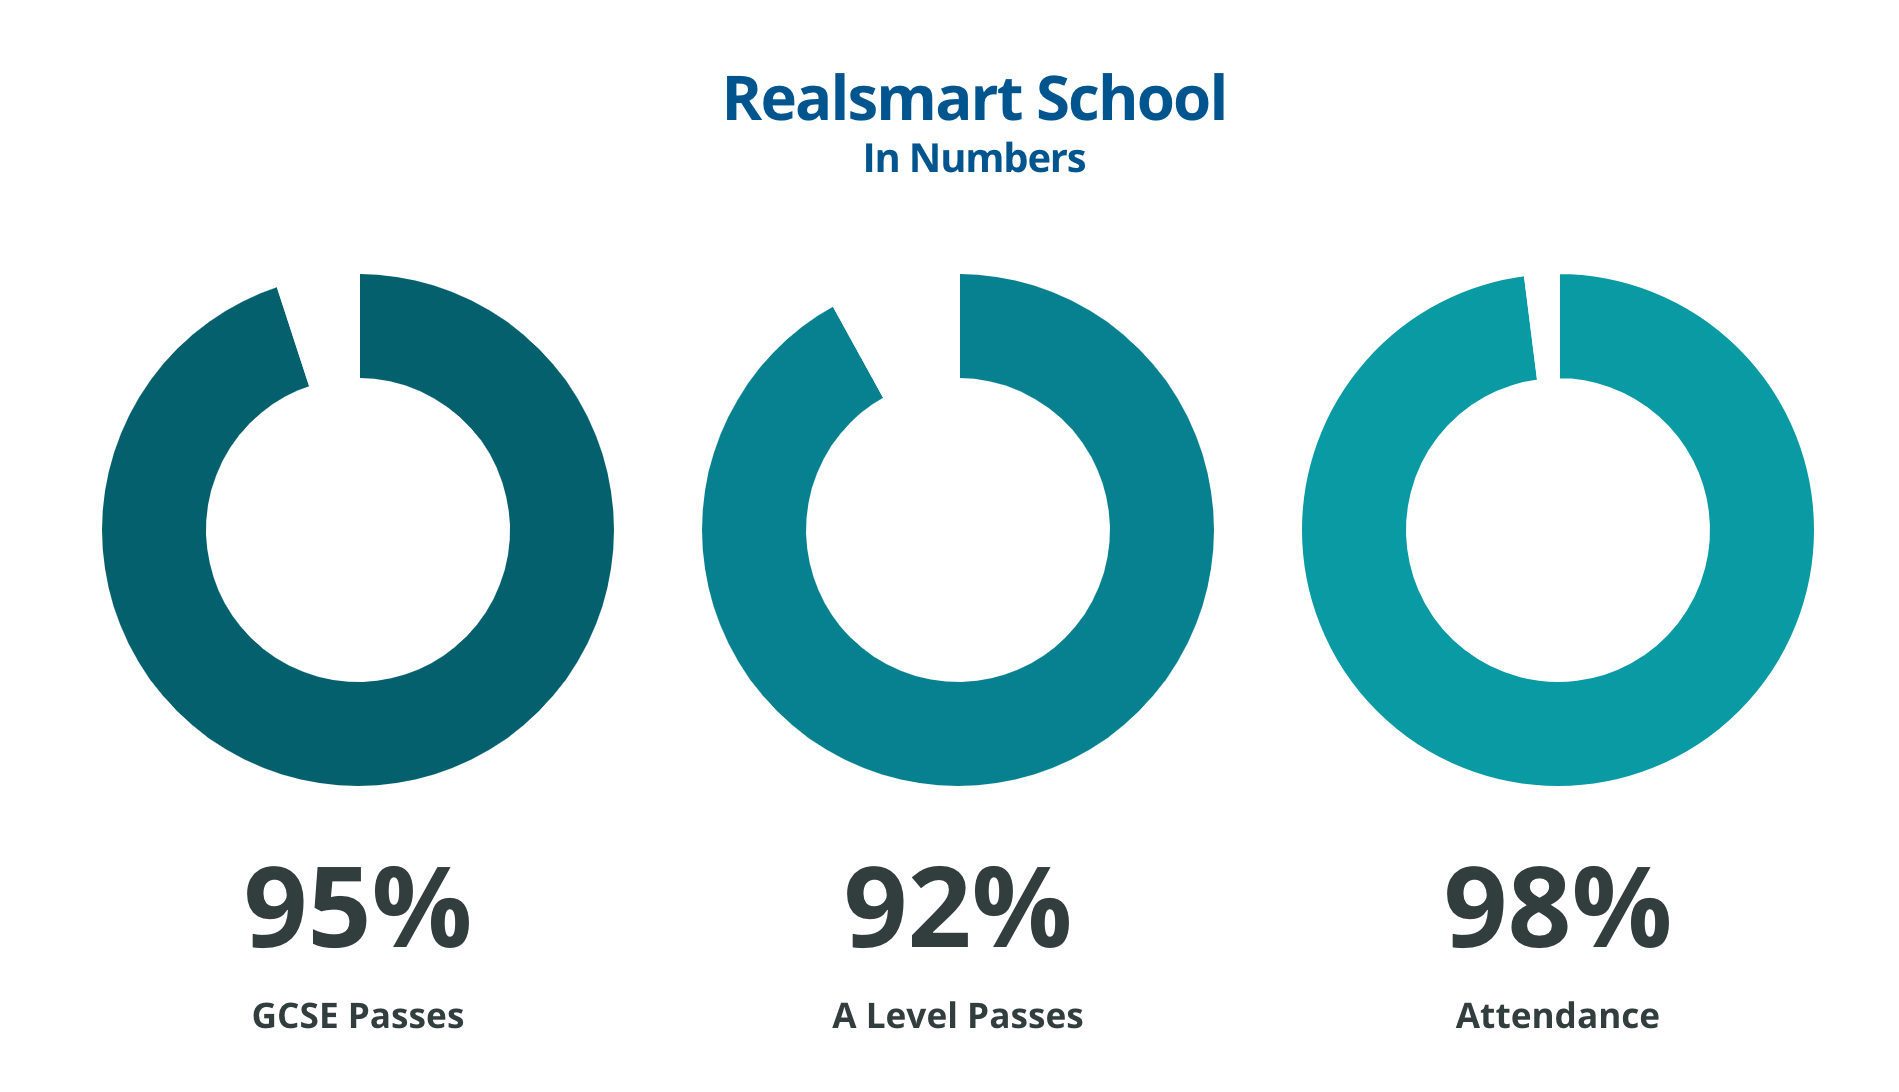
Here is an example of smartstats with parameters applied:
[smart_stats background_colour="#616E7C" cutout="75" title="Realsmart School" description="In Numbers"]
   [smart_stat background_colour="#05606E" id="gcse_passes" title="GCSE Passes" pie_percentage="95" value="95%" type="doughnut"][/smart_stat]
   [smart_stat background_colour="#07818F" id="a_level_passes" title="A Level Passes" pie_percentage="92" value="92%" type="doughnut"][/smart_stat]
   [smart_stat background_colour="#099AA4" id="attendance" title="Attendance" pie_percentage="98" value="98%" type="doughnut"][/smart_stat]
[/smart_stats]
Once you have copied this, paste it into the page in the text editor view, click update/publish, and then refresh the page.

